
At What Price Should I Buy a Stock?
Deciding at what price to buy a stock or other security is almost as hard as deciding whether to buy the security at all. There are many different approaches for deciding at what price to buy a stock. One of the ones I’ve seen discussed most often is dollar-cost averaging. Other strategies include (1) buying the position on whatever day you decide to buy it and (2) setting a target price that is below the current trading price, among many others. In this post, I’ll explain and compare these three strategies.
Dollar-Cost Averaging
Dollar cost-averaging is a strategy for buying stocks that is intended to reduce the risk that you will “buy high.”
How it Works
Here are the key steps for implementing this strategy:
Identify the security you want to buy.
Determine how much money you have to invest in that security.
Divide that amount into equal increments. In the examples below, I have split the amount into four increments.
Decide over what time period you want to make your purchases. In the examples below, I have illustrated a purchasing time period of four weeks.
Invest one increment at points in time evenly spaced over your selected time period. For example, let’s say you want to invest over four weeks. You might buy the selected security every Wednesday in four equal pieces. If you have $1,000 to invest, you would buy $250 of the selected security each Wednesday for four weeks.
The underlying premise of this approach is that you buy more shares of the selected security than if you happened to have bought the security on a day that the price is high. Specifically, because you are buying the security in equal dollar amounts, you will buy more shares when the price is low and fewer shares when the price is high. As such, your average purchase price will be low.
Simple Example
Here’s a simple example in which you invest a total of $4,800 in increments of $1,200 a week for four weeks.

In this example, you buy a total of 500 shares. If you had bought all of your shares on at $10 (the first week price), you would have 480 shares ($4,800 / $10). In this scenario, you will have 4% more shares ([500 – 480]/480 – 1) if you use dollar-cost averaging than if you bought all of your shares at the first week's price. 4% more shares corresponds to 4% more money when you sell the security. Although 4% may not sound like a large difference, it can add up over time as you buy and sell stocks.
To be clear, though, dollar-cost averaging isn’t always better. If you had bought all of your shares at the Week 3 price of $8, you would have 600 shares or 20% more than if you used dollar-cost averaging.
Investing Strategies
Here are the three strategies for determining when to buy a security that I’ll use for illustration.
Strategy 1 – Invest Immediately
Invest all of your available money on the day you decide to make the purchase.
Strategy 2 – Dollar-Cost Averaging
Use dollar-cost averaging by buying ¼ of your money available on Wednesday of four consecutive weeks[1]. This strategy is similar to what happens when you buy securities in your employer-sponsored retirement account if you are paid weekly. Every week, you employer takes some of your wages and invests it in the security you have selected.
Strategy 3 – Wait for Price Drop
Invest all of your available money after the stock price has dropped by 5%. Hold your money in cash while waiting for the price to decrease.
More Examples
I’ve created a few more simple examples to compare the strategies for deciding when to buy a security. These examples are intentionally simple and therefore unrealistic. Nonetheless, they are helpful in understanding the different strategies because of their simplicity. In all of the examples, you have $1,000 to invest.
Smooth Increase
In the first scenario, the stock’s price goes up smoothly by 10% every year. A graph of its price over two years would look like this.

The chart below focuses on the first month of the above chart and includes the purchases for Strategies 1 and 2 as dots.Under Strategy 1 (big red dot), you buy all of your stock on the first day at $10 a share, so you are able to purchase 100 shares.Under Strategy 2 (smaller green dots), you would buy $250 of stock on each of the first, eighth, fifteenth and twenty-second days.

The table below shows the prices on those days and the number of shares you buy.

The total number of shares you buy is 99.73.Under Strategy 3, you never buy the stock because the price never decreases by 5%.
The table below compares the numbers of share bought under each strategy
In this scenario, there is very little difference between the first two strategies, though you will buy more shares if you invest immediately. Any time you delay your purchases in this scenario, you are certain to pay a higher price which reduces the number of shares you can buy. Under Strategy 3, because the price never decreases, you never buy the stock, so end up with the same amount of money with which you started.
Smooth Check Mark
The second illustration is stock whose price goes down smoothly for six months and then increases for the next 18 months. A graph of its price would look like this.

The chart below focuses on the first six months of the above chart and includes the purchases for all three strategies as dots.

Under Strategy 1 (big red dot), you buy all of your stock on the first day at $10 a share, so you are able to purchase 100 shares.Under Strategy 2 (smaller green dots), you buy $250 of stock on each of the first, eighth, fifteenth and twenty-second days. The table below shows the prices on those days and the number of shares you buy.

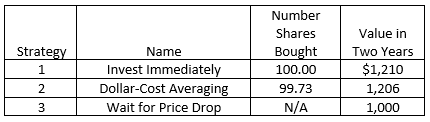
The total number of shares you buy is 100.30.Under Strategy 3, you buy 105.2 shares at $9.50 (5% below the initial price of $10) on day 177.The table below compares the numbers of share bought under each strategy and the amount of money you will have at the end of two years.
In this scenario, the best strategy is to wait until the price drops by 5% which happens to be the minimum price over the two-year period. The results of the other two strategies are very similar, though investing all of your money on the first day is the worst choice, as you buy stock during the period in which the price has fallen under the other two strategies.
Bumpy Increase 1
Next, we will look at two illustrations of what a stock price might actually look like. Here is a graph of the first illustration.

The chart below focuses on the first month of the above chart and includes the purchases for Strategies 1 and 2 as dots.

Under Strategy 1 (big red dot), you buy all of your stock on the first day at $10 a share, so you are able to purchase 100 shares.Under Strategy 2 (smaller green dots), you would buy $250 of stock on each of the first, eighth, fifteenth and twenty-second days. The table below shows the prices on those days and the number of shares you buy.

The total number of shares you buy is 101.24.Under Strategy 3, you don’t buy any shares because the price never falls by 5%.The table below compares the numbers of share bought under each strategy

In this scenario, the best strategy is to buy your stock using Dollar-Cost Averaging (Strategy 2), but only by a small amount compared to using the Invest Immediately strategy. You will have 1% more money than if in you invest it all on the first day and 13% more money than if you wait for the price to drop.
Bumpy Increase 2
The second realistic illustration is exactly the same as the first one with the exception that, in the first month, the price bounces around a bit above the initial $10 price rather than just below it. The chart below focuses on the first month for this illustration and includes the purchases for Strategies 1 and 2 as dots.

Under Strategy 1 (big red dot), you buy all of your stock on the first day at $10 a share, so you are able to purchase 100 shares.
Under Strategy 2 (smaller green dots), you would buy $250 of stock on each of the first, eighth, fifteenth and twenty-second days. The table below shows the prices on those days and the number of shares you buy.

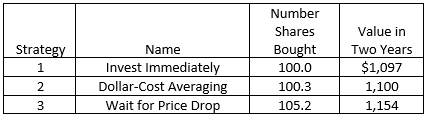
The total number of shares you buy is 99.04.Under Strategy 3, you don’t buy any shares because the price never falls by 5%.The table below compares the numbers of share bought under each strategy

In this scenario, the best strategy is to use the Invest Immediately strategy (Strategy 1), but only by a small amount compared to Dollar-Cost Averaging. You will have 1% more money than if in you use Dollar-Cost Averaging and 14% more money than if you wait for the price to drop.
More Realistic Examples
Now that you have a better understanding of the three different strategies, I’ll turn to even more realistic scenarios.
The first of these scenarios will use the actual returns on the S&P 500 from 1928 through early 2020. This scenario is likely to be relevant when you are considering an investment in an index fund.
The second scenario is intended to be similar to an investment in an individual stock. To create the example, I took the S&P 500 times series and doubled the volatility.[2]
The daily stock prices are illustrated in the graph below.

Investment Horizons
To illustrate the impact of the different strategies, I looked at three different time periods over which you might hold the stocks – one year, five years and ten years. If you are young and hold a stock until you retire, such as I have with some of the stocks I own, you might own the stock for 30 or 40 years. I didn’t feel there was enough data available in the above time series to look at the impact on owning securities for more than ten years. So, if you think you will be a very long-term investor, you will want to focus on the ten-year results. Also, these analyses are not helpful to people who plan to own stocks over very short periods of time, such as some traders who might buy and sell a security in the same day.
Comparison of Realistic Results
The table below compares how much money you would have, on average across all possible starting dates for which data were available, at the end of each of the three time periods if you used each of the three strategies to buy $1,000 of an S&P 500 index fund.

The table below compares how much money you would have, on average, at the end of each of the three time periods if you used each of the three strategies to buy $1,000 of the illustrative stock.

Dollar-Cost Averaging vs. Invest Immediately
For both the S&P 500 and the illustrative stock, there are only very small differences (less than 0.3% for the one-year investment horizon and less than 1.3% for the longer investment horizons) in the average amount of money at the end of each of one, five and ten year between the Dollar-Cost Averaging and Invest Immediately strategies.
Wait for Price Drop
On the other hand, there is a larger difference between the average amount of money at the end of the three time periods if you use the Wait for Price Drop strategy and the average amount using either of the other two strategies. For the S&P 500, you will have between 5% and 20% less money, on average, if you use the Wait for Price Drop strategy than if you use the Invest Immediately strategy, depending on your investment horizon.For the more volatile illustrative stock, you will have between 1% and 5% less money, on average, if you use the Wait for Price strategy than if you use the Invest Immediately strategy. With the higher volatility of the illustrative stock, it is more likely to have a 5% price drop. There are therefore fewer scenarios in which you don’t get any investment return than there are using the S&P 500 prices. As such, there is a smaller difference between the results of the Wait for Price Drop strategy and the other strategies for a more volatile security than for a more stable one.
Key Takeaways
As can be seen, the best strategy depends on the pattern and volatility of the security’s price. Briefly:
For securities that have fairly smooth trends, there isn’t a lot of difference between the Invest Immediately and Dollar-Cost Averaging strategies.
For securities with more volatile prices, such as the two Bumpy Increase scenarios, the choice between the Dollar-Cost Averaging and Invest Immediately strategies can be a bit larger. However, there isn’t one that is better in all situations – Dollar-Cost Averaging was better in Bumpy Increase 1 while Invest Immediately was better in Bumpy Increase 2. Because you can’t know whether your security’s price will follow a pattern closer to Bumpy Increase 1 or Bumpy Increase 2, neither strategy is preferred.
If you think that the price of the stock might trend down somewhat significantly or has a lot of volatility allowing the price to be significantly lower than the current price, waiting for a 5% (or other value you select) price decrease (Strategy 3) could be the best strategy. The drawback of this strategy is that there are a lot of scenarios in which you will never buy the security and then will get no return.
What Do I Do?
With all this information, you might wonder what I do. I first need to provide a little background about my current investing situation, as it is likely to be different from yours.I am retired, so am starting to spend my investments. As such, I have a shorter investment horizon than I did when I was younger and in the saving mode. I have a number of stocks and a few mutual funds that I have owned for many, many years and do very little trading of those positions.
Another portion of my money is in sector funds (index funds that focus on one segment of the economy, such as industrial companies, healthcare or technology) and a few large companies. I tend to hold those securities for six months to two years. The securities I am trading are closer in nature to the S&P 500 time series than even the hypothetical company with twice the volatility as the S&P 500. As such, the Wait for Price Drop strategy doesn’t work for me.
With the very small differences between the Dollar-Cost Averaging and Invest Immediately strategies, I choose the Invest Immediately strategy because it is easier. I have to place only one buy order instead of several orders.
Limit and Market Orders
As discussed in my post on stocks, there are different types of orders you can place when you want to buy a stock. I always place limit orders. A limit order allows me to buy a stock from the first person who wants to sell it to me at the price I have stated in the order.The other type of order is a market order. If you place a market order, you don’t get to set the price. You buy the stock at whatever price it is trading at the moment you place the order.
There are risks to both types of orders. If you place a market order and the price jumps up, you will buy the stock at the higher price. If you place a limit order for a price below the current market price, you might never buy it similar to the Wait for Price Drop strategy.
A Compromise
To avoid the risk that I might buy a stock at a significantly higher price than I intend, I place a limit order with a limit that is about half way between the closing price and the low price from the previous day. (I almost always place my orders over the weekend, so don’t have “up-to-the-minute” prices.) This difference is often between 0.5% and 1% of the price. By taking this strategy, I get a very small boost to my return by setting my limit below the market price but with very little risk that I won’t buy the stock because I have chosen the limit amount to be within a single day’s trading range. The additional 0.5% to 1% doesn’t sound like a lot, but if I am able to increase my total return by that amount every year or two, it compounds quickly.
Footnotes
[1] There is nothing special about once a week for four weeks. I did some testing of once a day for five days and found that there wasn’t a lot of difference in the number of shares bought, on average across a wide range of scenarios, from what the number using once a week for four weeks. I also did some testing of what happens when you buy shares once a month for a year. Across a wide range of realistic scenarios, you own fewer shares on average if you spread your purchases over a year as you purchase securities that you think will increase in price. If the price of the security increases over the year, you will buy some of your shares at the higher price and own fewer shares.
[2] This note explains the nitty gritty details of how I adjusted the S&P 500 time series to create the second scenario. I calculated the 200-day moving average of the daily closing prices of the S&P 500 from 1928 to early 2020. The deviation is the actual closing price minus the moving average. I doubled this deviation and added it back to the moving average to simulate prices for the hypothetical stock.