

Annual Retirement Savings Targets
Once you know how much you want to save for retirement, you need a plan for building that savings. Your annual retirement savings target depends on your total savings target, how many years you have until you want to retire and how much risk you are willing to take in your portfolio. In this post, I’ll provide information you can use to set targets for how much to contribute to your retirement savings each year.
Key Variables
There are several variables that will impact how much you’ll want to target as contributions to your retirement savings each year. They are:
Your total retirement savings target.
How much you already have saved.
The number of years you are able to contribute to your retirement savings.
How much risk you are willing to take in your portfolio.
The impact of taxes on investment returns between now and your retirement. That is, what portion of your retirement savings will be in each of taxable accounts, tax-deferred retirement savings accounts and tax-free retirement savings accounts. For more information on tax-deferred and tax-free retirement savings accounts, check out this post. I provide a bit more insight on all three types of accounts in these posts on how to choose which assets to buy in which type of account in each of the US and Canada.
Some of these variables are fairly straightforward. For example, you can check the balances of any accounts with retirement savings that you already have and you can estimate (within a few years, at least) how many years until you retire.
Other variables are more challenging to estimate. For example, I dedicated a whole separate post to the topic of setting your retirement savings target.
Your Risk Tolerance
Your risk tolerance is a measure of how much volatility you are willing to take in your investments. As indicated in my post on risk, the more risk you take the higher your expected return but the wider the possible range of results. My post on diversification and investing shows that the longer period of time over which you invest, the less volatility has been seen historically in the annualized returns.Here are a few thoughts that might guide you as you figure out your personal risk tolerance.
If you have only a few years until you retire, you might want to invest fairly conservatively. By investing conservatively, you might want to invest in money market or high-yield savings accounts that currently have yields in the 5% (as of 1/3/24).
If you have five to ten years until you retire or are somewhat risk averse (i.e., can’t tolerate the ups and downs of the stock market), you might want to invest primarily in bonds (discussed in this post) or bond mutual funds. Depending on the maturity, US government bonds are currently yielding between 4% and 5% (as of 1/3/24) and high-quality corporate bonds are currently returning between 5.4% and 5.8% (as of 1/3/24).
If you have a longer time period to retire and/or are able to tolerate the volatility of equities (discussed in this post), you might invest in an S&P 500 index fund or an index fund that is even more risky. These funds have average annual returns of 8% or more.
As can be seen, the more risk you take, the higher the average return. As you are estimating how much you need to save each year for retirement, you’ll need to select an assumption about your average annual investment return based on these (or other) insights and your personal risk tolerance.
Taxability of Investment Returns
In addition to considering your risk tolerance, you’ll need to adjust your investment returns for any taxes you need to pay between the time you put the money in the account and your retirement date. For this post, I’ve assumed that your savings amount target includes income taxes, as suggested in my post on that topic. If it does, you only need to be concerned with taxes until you retire in estimating how much you need to save each year.
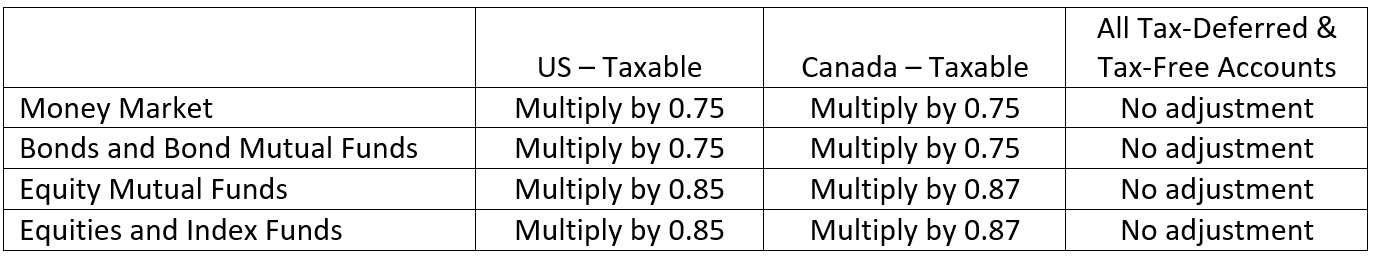
In the previous section, you selected an average annual investment return. The table below provides approximations for adjusting that return for Federal income taxes based on the type of financial instruments you plan to buy and the type of account in which you hold it.
Further Refinements to Tax Adjustments
You'll need to subtract your state or provincial income tax rate from each multiplier. For example, if you state or provincial income tax rate is 10%, you would subtract 0.10 from each multiplier. For Equities and Index Funds, the 0.85 multiplier in the US-Taxable column would be reduced to 0.75.
The assumptions in this table for equities and index funds in particularly and, to a lesser extent, equity mutual funds, are conservative. Specifically, if you don’t sell your positions every year and re-invest the proceeds, you will pay taxes less than every year. By doing so, you reduce the impact of income taxes. Nonetheless, given all of the risks involved in savings for retirement, I think these approximations are useful even if they cause the estimates of how to save every year to be a bit high.
Also, the tax rates for bonds and bond mutual funds could also be conservative depending on the types of bonds you own. The adjustment factors shown apply to corporate bonds. The tax rates on interest on government bonds and some municipal bonds are lower.
Calculation of After-Tax Investment Return
From the table above, it is clear that calculating your after-tax investment return depends on both the types of investments you plan to buy and the type of account in which you plan to hold them. The table below will help you calculate your overall after-tax investment return.

There are three assumptions you need to enter into this table that reflect the types of financial instruments you will buy (i.e., reflecting your risk tolerance) and the types of accounts in which you will hold those assets in the Percent of Portfolio column. These assumptions are the percentages of your retirement savings you will invest in:
Money markets, bonds or mutual funds in taxable accounts.
Equities, equity mutual funds and index funds in taxable accounts.
Tax-deferred or tax-free accounts (IRAs, 401(k)s, RRSPs and TFSAs).
For each of these three groups of assets, you’ll put the average annual return you selected from the Risk Tolerance section above in the Pre-Tax return column. You also may need to adjust the multipliers as discussed above.Once you have filled in those six boxes, you will multiply the three numbers in each row together to get a single product in the last column of each row. Your weighted average after-tax investment return will be the sum of the three values in the last column.
Illustration of Weighted Average Return Calculation
I have created an illustration in the table below. For this illustration, I have assumed that you will invest 50% of your portfolio in bonds and 50% in equities. You are able to put 60% of your portfolio in tax-deferred and tax-free accounts. Although not consistent with my post on tax-efficient investing, you split your bonds and stocks between account types in the same proportion as the total. As such, you have 20% of your portfolio in taxable accounts invested in each of bonds and equities. The 60% you put in your tax-deferred and tax-free accounts goes in the All Other row.

I’ll use a pre-tax return on bonds of 3% and equities of 8%. Because the All Other category is 50/50 stocks and bonds, the average pre-tax return for that row is the average of 3% and 8% or 5.5%.I then calculated the products for each row. For example, in the first row, I calculated 0.5% = 20% x 3% x 0.75. The weighted average after-tax investment return is the sum of the three values in the product column or 5.2% = 0.5% + 1.4% + 3.3%. The 5.2% will be used to help estimate how much we need to save each year to meet our retirement savings target.
Annual Savings Targets
By this point, we have talked about how to estimate:
Your total retirement savings target
The number of years until you retire
An after-tax investment return that is consistent with your risk tolerance and the types of accounts in which you plan to put your savings
With that information, you can now estimate how much you need to save each year if you don’t have any savings yet. I’ll talk about adjusting the calculation for any savings you already have below.
I assumed that you will increase your savings by 3% every year which would be consistent with saving a constant percentage of your earnings each year if your wages go up by 3% each year. For example, if you put $1,000 in your retirement savings this year, you will put another $1,030 next year, $1,061 in the following year and so on. In this way, your annual retirement savings contribution will be closer to a constant percentage of your income.
Annual Savings/Total Target
The graph and table below both show the same information – the percentage of your retirement savings goal that you need to save in your first year of savings based on your number of years until you retire and after-tax annual average investment return.

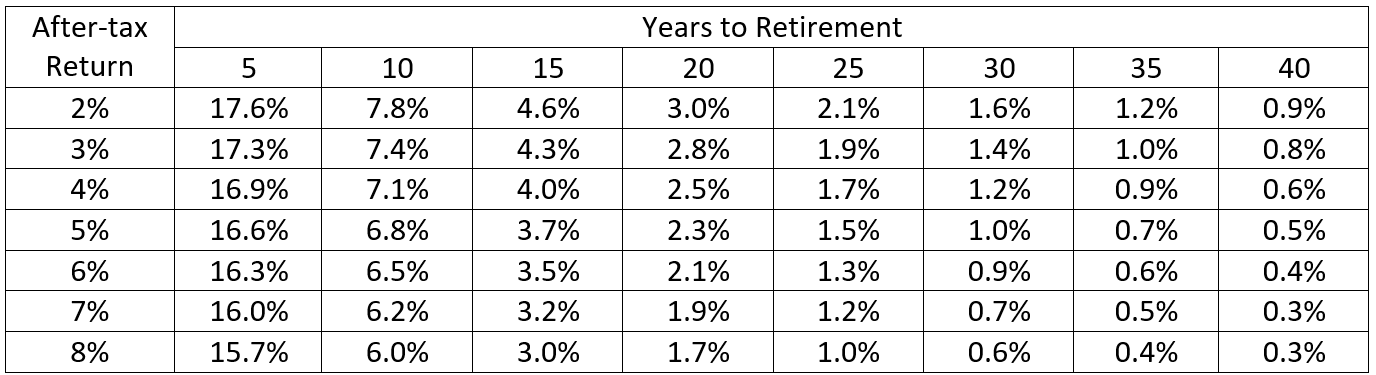
As you can see, the more risk you take, the less you need to save on average. That is, as you go down each column in the table or towards the back of the graph, the percentage of your target you need to save in the first year gets smaller. Also, the longer you have until you retire (as you move right in the table and graph), the smaller the savings percentage. I caution those of you who have only a few years until retirement, though, that you will want to think carefully about your risk tolerance and may want to use the values in the upper rows of the table corresponding to lower risk/lower return investments, as there is a fairly high chance that your savings will be less than your target due to market volatility if you purchase risky assets.
How to Use the Table
First find the percentage in the cell with a row that corresponds to your after-tax investment return and a column that corresponds to your time to retirement. You multiply this percentage by your total retirement savings target. The result of that calculation is how much you need to save in your first year of saving. To find out how much to save in the second year, multiply by 1.03. Keep multiplying by 1.03 to find out how much to save in each subsequent year.
Earlier in this post, I created an example with a 5.2% after-tax investment return. 5.2% is fairly close to 5%, so we will look at the row in the table corresponding to 5% to continue this example. I have calculated your first- and second-year savings amounts for several combinations of years to retirement and total retirement savings targets for someone with a 5% after-tax investment return below.
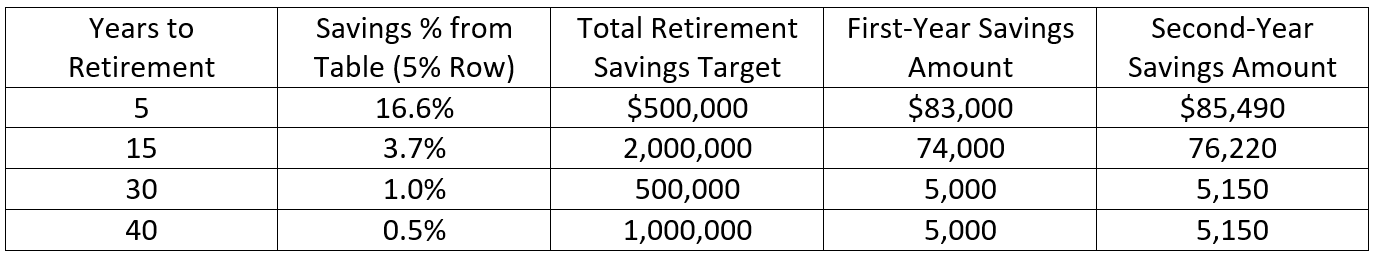
The first-year savings amounts in this table highlight the benefits of starting to save for retirement “early and often.” It is a lot easier to save $5,000 a year than $75,000 or $85,000 a year. By comparing the last two rows, you can see the benefits of the extra 10 years between 30 years of savings and 40 years of savings. With the same starting contributions, on average, you end up with twice as much if you save consistently for 40 years than if you do so for 30 years.
Adjusting for Savings You Already Have
The calculations above don’t take into account that you might already have started saving for retirement. If you already have some retirement savings, you can reduce the amount your need to save each year.
The math is a bit complicated if you don’t like exponents, but I’ll provide a table that will make it a bit easier. To adjust the annual savings calculation for the amount you already have saved, you need to subtract the future value of your existing savings from your total retirement savings target. The future value is the amount to which your existing savings will grow by your retirement date. The formula for future savings is:

where n is the number of years until you retire. The annual return is the same return you’ve been using in the formulas above. If you don’t want to deal with the exponent, the table below will help you figure out the factor by which to multiply your current amount saved.

Illustration of Adjustment for Existing Savings
Let’s say you have $50,000 in retirement savings, 25 years until you retire and have selected an annual return of 5%. You would use the factor from the 5% row in the 25 years column of 3.39. You multiply $50,000 by 3.39 to get $169,500.If your total retirement savings target is $1,000,000, you subtract $169,500 and use an adjusted target of $830,500. Using the same time to retirement and annual return, your annual savings target is 1.5% of $830,500 or $12,458. This annual savings amount compares to $15,000 if you haven’t saved any money for retirement yet.
Caution
Having been subject to Actuarial Standards of Practice for most of my career (which started before the standards existed), I can’t finish this post without providing a caution. All of the amounts that I’ve estimated in this post assume that you earn the average return in every year. There aren’t any financial instruments that can guarantee that you’ll earn the same return year in and year out. As mentioned above, riskier assets have more volatility in their returns. That means that, while the average return is higher, the actual returns in any one year are likely to be further from the average than for less risky assets.A
s such, you should be aware that the amounts shown for annual savings will NOT assure you that you will have your target amount in savings when you retire. I suggest that, if possible, you set a higher target for your total retirement savings than you think you’ll really need or save more each year than the amounts resulting from these calculations. You don't want to be in the situation in which my friend found herself at age 59 starting over financially.