

Investing for Dividends
Investing for dividends is one of many strategies investors use to identify stocks for their portfolios. Among the strategies I identified in my post on what you need to know about stocks, this is not one that I have ever used. So I reached out to one of my Twitter followers who uses it to get more information, Dividend Diplomats (aka Lanny and Bert) to get some real-life insights. With Lanny’s and Bert’s help, I will:
define dividends.
talk about the criteria that Lanny and Bert use for selecting companies and why they are important.
show some historical returns for dividend-issuing companies.
explain the tax implications of dividends on your total return.
What are Dividends?
A dividend is a cash distribution from a company to its shareholders. The amount of the dividend is stated on a per-share basis. The amount of cash you receive is equal to the number of shares you own times the amount of the dividend.
When companies announce that they are going to pay a dividend, they provide two dates. The first is the date on which share ownership is determined (also known as the ex-dividend date). The second is the date on which the dividend will be paid. For example, a company might declare a 15 cent dividend to people who own shares on May 1 payable on May 15. Even if you sell your stock between May 1 and May 15, you will get 15 cents for every share you owned on May 1.When a company earns a profit, it has two choices for what to do with the profit. Under one option, the company can keep the profit and use it to support future operations. For example, the company might buy more equipment to allow it to increase the number of products is makes or might buy another company to expand its operations. Under the second option, the company distributes some or all of its profit to shareholders as dividends.
My experience is that companies that are growing rapidly tend to keep their profits, whereas companies that can’t find enough opportunities to reinvest their profits to fund growth tend to issue dividends.
Dividend Diplomats – A Little Background
Lanny and Bert have been blogging for over 5.5 years and have been best friends for 7. They both are pursuing the same goal of reaching financial freedom and retiring early to break the "9 to 5" chains. They hope to achieve financial freedom through dividend investing, frugal living, and using as many "personal finance" hacks as possible to keep expenses low and bring in additional income. For more information about the Dividend Diplomats, check out their web site at www.dividenddiplomats.com.
Why Use the Investing for Dividends Strategy
As you’ll see in future posts, I have used several strategies for my stock investments, but have never focused on investing for dividends.
My Preconceived Notions
I have always considered investing for dividends as most appropriate for people who need the cash to pay their living expenses, such as people who are retired. I am retired, but currently have cash and some bonds that I use to cover my living expenses. As I get further into retirement, I will need to start liquidating some of my stocks or start investing for dividends.
Lanny’s & Bert’s Motivation
So, when I started reading about Lanny and Bert, I wondered why people who are still working (and a lot younger than I am) would be interested in investing for dividends. Here’s what they said.
“There were a few different motivating factors. Lanny had endured a very difficult childhood, where money was always limited and his family had struggled financially. Due to this, he personally wanted to never have to worry about money, period.Bert was not a dividend growth investor until he met Lanny. Once he talked to Lanny, learned about dividend investing, and saw the math, he was sold and hasn't looked back since. Therefore, we are looking to build a growing passive income stream so we can retire early and pursue our passions. Building a stream of growing, truly passive dividend income has always been a very attractive option to us.
We love the fact that dividend income is truly passive (outside of initial capital, we don't have to lift a finger) and we are building equity in great, established companies that have paid dividends throughout various economic cycles. Second, the math just makes sense. It is crazy how quickly your income stream grows when you are anticipating a dividend growth rate of 6%+ (on average).
Lanny writes an article each quarter showing the impact of dividend increases and we have demonstrated the impact of dividend reinvesting on our site in the past. When you see the math on paper, it is insane.”
Lanny and Bert provided links to a couple of their posts that illustrate the math: Impact of Dividend Increases and Power of Dividend Reinvesting.
Lanny’s & Bert’s Strategy
Lanny and Bert developed a dividend stock screener that helps them identify undervalued dividend growth stocks in which to consider investing. At a minimum, the companies must pass three metrics to be further considered for investment:
Valuation (P/E Ratio) less than the market average.
Payout Ratio Less than 60%. (Unless the industry has a higher benchmarked figure. i.e. oil, tobacco, utilities, REITs, etc., then they compare to the industry payout ratio.)
History of increasing dividends.
They don’t consider dividend yield until later in the process. They never advocate chasing dividend yield at the risk of dividend safety. That is, they would rather a dividend that has very low risk of being reduced or eliminated (i.e., safety) than a higher dividend be unsustainable over the long term.That's why they don't look at yield initially. It allows them to focus on the important metrics that help them gain comfort over the safety of the dividend. Here is a link to their Dividend Stock Screener.
Payout Ratio
Lanny and Bert mention that that one of their key metrics is a payout ratio. A dividend payout ratio is the annual amount of a company’s dividend divided by its earnings per share. For more about earnings per share, check out my post on reading financial statements.
A dividend payout ratio of less than 1 means that a company is retaining some of its earnings and distributing the rest. If the ratio is more than 1, it means that the company is earning less money than it is paying out in dividends.
I worked for a company that had a payout ratio of more than 1. When I first started working there, the company had more capital than it could use. The company was returning its excess capital to its shareholders through the high dividend. After several years, the company’s capital approached the amount it needed to support its business. If it had cut its dividend to an amount lower than its earnings, the stock price might have decreased significantly. Instead, the company was sold. Had the company not been sold, its shareholders might have had both a decrease in future dividend payments and a reduction in the value of their stock at the same time. This double whammy (dividend cut at the same time as a price decrease) is a risk of owning a stock in a dividend-issuing company especially those with high dividend payout ratios.
Performance – Lanny and Bert’s View
Lanny and Bert are not assuming they can do better than management or the market. As noted above, they tend to focus on companies with a dividend payout ratio less than 60%. This approach allows for all three of increasing dividends to shareholders, share repurchases, and internal growth for profit. Also, this approach ensures the company is continuing to invest in itself as well. You can't pay a dividend in the future if you can't grow, or even maintain, your current earnings stream. Therefore, if revenues are stagnant or shrinking, the safety of the company's dividend comes into question. Companies "can" pay out a dividend that is larger than your earnings over the short-to-medium term. However, it is not sustainable as was the case with the company for which I worked.
Historical Performance
I was curious about how stocks that met Lanny and Bert’s criteria performed. I have a subscription to the ValueLine Analyzer Plus. It contains current and historical financial data and stock prices about hundreds of companies. I looked at two time periods. I first looked at the most recent year (November 2018 to November 2019). Because I was curious about how those stocks performed in the 2008 crash, I also looked at the ten-year period from 2003 to 2013. I would have used a shorter period around the 2008 crash and the period thereafter, but didn’t save the data in the right format so had to look at time periods for which I had saved the data in an accessible manner.
How I Measured Performance
For both time periods, I identified all stocks for which the data I needed for the analysis were available at both the beginning and end of the period. There were 1,505 companies included in the sample in the 2018-2019 period and 952 companies for the 2003 to 2013 period.
I then identified companies (a) whose dividend grew in each of the previous two fiscal years, (b) whose dividend payout ratio was less than 60% and (c) whose P/B ratio was less than the average of all of the companies in the same. That is, I attempted to identify the companies that met Lanny and Bert’s criteria. There were 332 companies in the 2018-2019 period and 109 companies in the 2003-2013 period that met these criteria.
ValueLine ranks companies based on what it calls Timeliness, with companies with Timeliness ratings of 1 having the best expected performance and those having a rating of 5 having the worst expected performance. Because I suspected that Bert and Lanny’s screen would tend to select more companies with favorable Timeliness ratings than those with poorer ones, I looked at both the overall results, as well as the results by Timeliness rating.
November 2018 – November 2019
In the most recent year, the stocks that met Lanny’s and Bert’s criteria had an average total return (dividends plus change in stock price) of 11% as compared to 8.5% for the total sample. That is, in the current market, dividend issuing companies meeting their criteria returned more than the average of all companies.
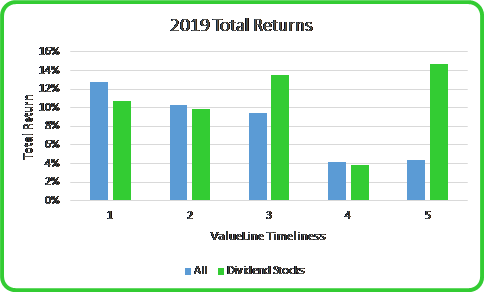
Interestingly, when I stratified the companies by Timeliness rating, it showed that for companies with good Timeliness ratings (1 and 2), Lanny’s and Bert’s companies underperformed the group. For companies with two of the three lower Timeliness ratings (3 and 5), though, Lanny’s and Bert’s companies not only did better than the average of all companies in the group, but also did better than even the group of companies with a Timeliness rating of 1! It looks to me as if their approach might identify some gems in what otherwise appear to be poorer performing companies.The chart below shows these comparisons.
2003 to 2013
Over the longer time period from 2003 to 2013, the companies meeting Lanny’s and Bert’s criteria didn’t do quite as well as the average of all companies. In this case, the stocks meeting their criteria had a compound annual return of 5% as compared to 7% for all stocks in the sample. Without more data, it is hard to tell whether the difference in return is the sample of dividend-issuing companies is small, because those companies didn’t fare as well during the Great Recession or something else.
I looked at the total returns by Timeliness rating and the results were inconsistent for both the “all stocks” group and the ones that met our criteria. A lot can happen in 10 years! Nonetheless, it was interesting to see that the dividend-yielding stocks that had Timeliness ratings of 5 in 2003 out performed all other subsets of the data. So, while these stocks didn’t have quite as high a total return over the 10-year period in the aggregate, there are clearly some above-average performers within the group.
Tax Ramifications of Dividends
One of the drawbacks of investing in companies with dividends, as opposed to companies that reinvest their earnings for growth, is that you might need to pay taxes on the dividend income as it gets distributed.
Types of Accounts
If you hold your dividend-yielding stocks in a tax-deferred (e.g., Traditional IRA or 401(k) in the US or RRSP in Canada) or tax-free (e.g., Roth IRA or 401(k) in the US or TFSA in Canada), it doesn’t matter whether your returns are in the form of price appreciation or dividends. Your total return in each of those types of accounts gets taxed the same. That is, if you hold the stocks in a tax-deferred account, you will pay tax on your total returns, regardless of whether it is interest, dividends or appreciation, at your ordinary income tax rate. If you hold the stocks in a tax-free account, you won’t pay taxes on any returns.
The only type of account in which it matters whether your return is in the form of price appreciation or dividends is a taxable account. In the US, most people pay 15% Federal income tax plus some additional amount for state income taxes on dividends in the year in which they are issued. They pay taxes at the same rate on capital gains, but only when the stock is sold, not as the price changes from year to year. In Canada, the difference is even greater. Dividends are taxed at your ordinary income tax rate (i.e., they are added to your wages) and capital gains are taxed at 50% of your ordinary income tax rate and only when you sell the stock.
Dividend Reinvestment
When you earn dividends from a company, you often have the option to automatically reinvest the dividends in the same company’s stock. This process is a dividend reinvestment plan. Lanny and Bert take this approach.
Dividend reinvestment plans are terrific ways to make sure you stay invested in companies that you like, as you don’t have to remember to buy more stock when the dividend is reinvested. The drawback of dividend reinvestment plans is that you will owe tax on the amount of the dividend, even if you don’t receive it in cash. If you reinvest 100% of your dividends, you’ll need to have cash from some other source to pay the taxes unless you hold the investments in a tax-free or tax-deferred account.
Illustration
Let’s assume you are a US investor subject to the 15% Federal tax rate and pay no state income tax. You have two companies you are considering. You expect each to have a total return of 8%. One company’s return will be 100% in dividends, while the other company issues no dividends. You plan to own the stock for 10 years. Your initial investment will be $1,000 and you will pay your income taxes out of your dividends, so you reinvest 85% of the dividends you earn each year.
At the end of the 10th year, you will have $1,931 if you buy the company with 8% dividends. If you buy the company with no dividends, your stock will be worth $2,159. After you pay capital gains tax of $174, you will have $1,985 or 2.8% more than if you buy stock in the company that issues 8% dividends.
If you pay Canadian taxes, the difference is even bigger because of the much lower tax rate on capital gains than dividends. Over the full ten-year period, you will end up with almost 11% more if you buy stock in the company with no dividends than if you buy stock in the dividend-issuing company.
As such, you’ll want to put as much of your portfolio of dividend-issuing stocks in a tax-deferred or tax-free account as possible to minimize the impact of taxes on your total return.


